Profiling edit
Profiling is, in a nutshell, assessing how quickly the various parts of your program run. Most often, you'll want your program to run fast, and using a profiler to find slow spots can help you decide what needs work. There is a simple profiler package included in tcllib: http://tcllib.sourceforge.net/doc/profiler.html Profiling Tcl has more on the subject.
Other profiling packages
etprof is a little profiler in pure-Tcl.Mark Smith's profiler.tcl, [1], is yet another pure-Tcl variation.tprof : A profiler for TCL scripts. Allows creation of profiling data sets and later analysis through a graphical frontend.Sage
 is a profiling tool for Tcl/Tk programs. It can collect and report data pertaining to where time is spent in your programs.
- DKF: That link is dead. I've recovered the file out of the Internet Archive and put a copy here
 as a temporary measure, but I don't plan to be involved long-term. I have put it up on github
 as well.
Paradyn
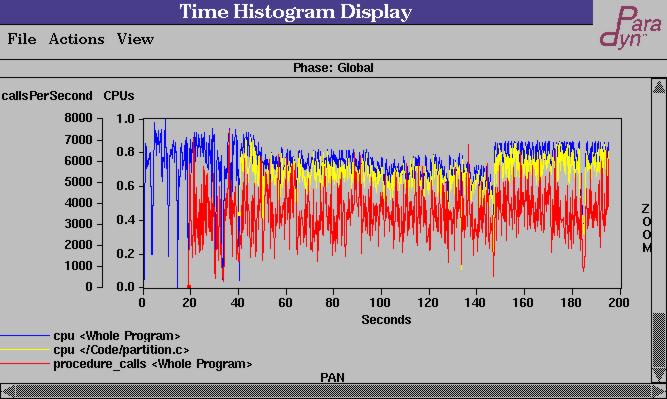
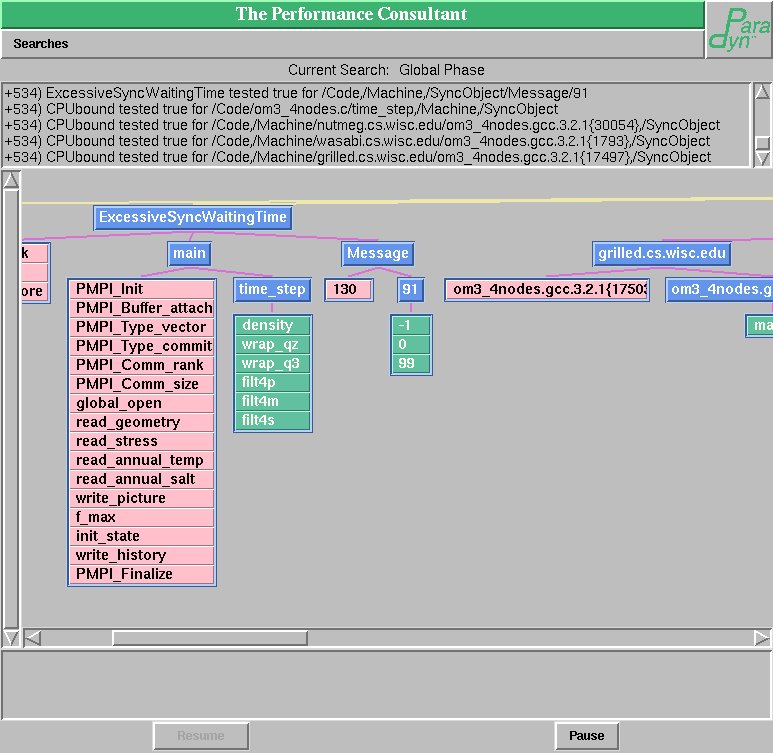
 is a performance measurement tool for parallel and distributed programs. Paradyn uses several novel technologies so that it scales to long running programs (hours or days) and large (thousand node) systems, and automates much of the search for performance bottlenecks. It can provide precise performance data down to the procedure and statement level.Paradyn uses Tcl/Tk for scripting and GUI.


