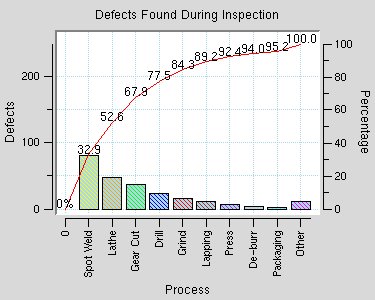
 package require BLT
 # --------------------------------------------------------------------------
 # Starting with Tcl 8.x, the BLT commands are stored in their own
 # namespace called "blt". The idea is to prevent name clashes with
 # Tcl commands and variables from other packages, such as a "table"
 # command in two different packages.
 #
 # You can access the BLT commands in a couple of ways. You can prefix
 # all the BLT commands with the namespace qualifier "blt::"
 #
 # blt::graph .g
 # blt::table . .g -resize both
 #
 # or you can import all the command into the global namespace.
 #
 # namespace import blt::*
 # graph .g
 # table . .g -resize both
 #
 # --------------------------------------------------------------------------
 if { $tcl_version >= 8.0 } {
    namespace import blt::*
    namespace import -force blt::tile::*
 }

 #
 # Example of a pareto chart.
 #
 barchart .b \
 -title "Defects Found During Inspection" \
 -font {Helvetica 12} \
 -plotpady { 12 4 }
 table . .b -fill both
 set data {
 "Spot Weld" 82 yellow
 "Lathe" 49 orange
 "Gear Cut" 38 green
 "Drill" 24 blue
 "Grind" 17 red
 "Lapping" 12 brown
 "Press" 8 purple
 "De-burr" 4 pink
 "Packaging" 3 cyan
 "Other" 12 magenta
 }

 # Create an X-Y graph line element to trace the accumulated defects.
 .b line create accum -label "" -symbol none -color red

 # Define a bitmap to be used to stipple the background of each bar.
 bitmap define pattern1 { {4 4} {01 02 04 08} }

 # For each process, create a bar element to display the magnitude.
 set count 0
 set sum 0
 set ydata 0
 set xdata 0
 foreach { label value color } $data {
    incr count
    .b element create $label -xdata $count -ydata $value \
    -fg $color -relief solid -bd 1 -stipple pattern1 -bg lightblue
    set labels($count) $label
    # Keep a running total of defects
    set sum [expr $value + $sum]
    lappend ydata $sum
    lappend xdata $count
 }

 # Configure the coordinates of the accumulated defects,
 # now that we know what they are.
 .b line configure accum -xdata $xdata -ydata $ydata

 # Add text markers to label the percentage of total at each point.
 foreach x $xdata y $ydata {
    set percent [expr ($y * 100.0) / $sum]
       if { $x == 0 } {
         set text "0%"
       } else {
         set text [format %.1f $percent]
       }
    .b marker create text \
    -coords "$x $y" \
    -text $text \
    -anchor c \
    -yoffset -5
 }

 # Display an auxillary y-axis for percentages.
 .b axis configure y2 \
 -hide no \
 -min 0.0 \
 -max 100.0 \
 -title "Percentage"

 # Title the y-axis
 .b axis configure y -title "Defects"

 # Configure the x-axis to display the process names, instead of numbers.
 .b axis configure x \
 -title "Process" \
 -command FormatLabels \
 -rotate 90 \
 -subdivisions 0

 proc FormatLabels { widget value } {
 global labels
 set value [expr round($value)]
 if {[info exists labels($value)] } {
   return $labels($value)
 }

 return $value
 }

 # No legend needed.
 .b legend configure -hide yes

 # Configure the grid lines.
 .b grid configure -mapx x -color lightblue
LV Note, however, that the above code doesn't work with Tk 8.5, as the tile namespace has been renamed. This renders all the BLT 2.4v demos, as well as the above demo, broken because of the namespace import. You have to edit that line, probably to use ttk, but I'm uncertain.

